
What Data Analytics Means
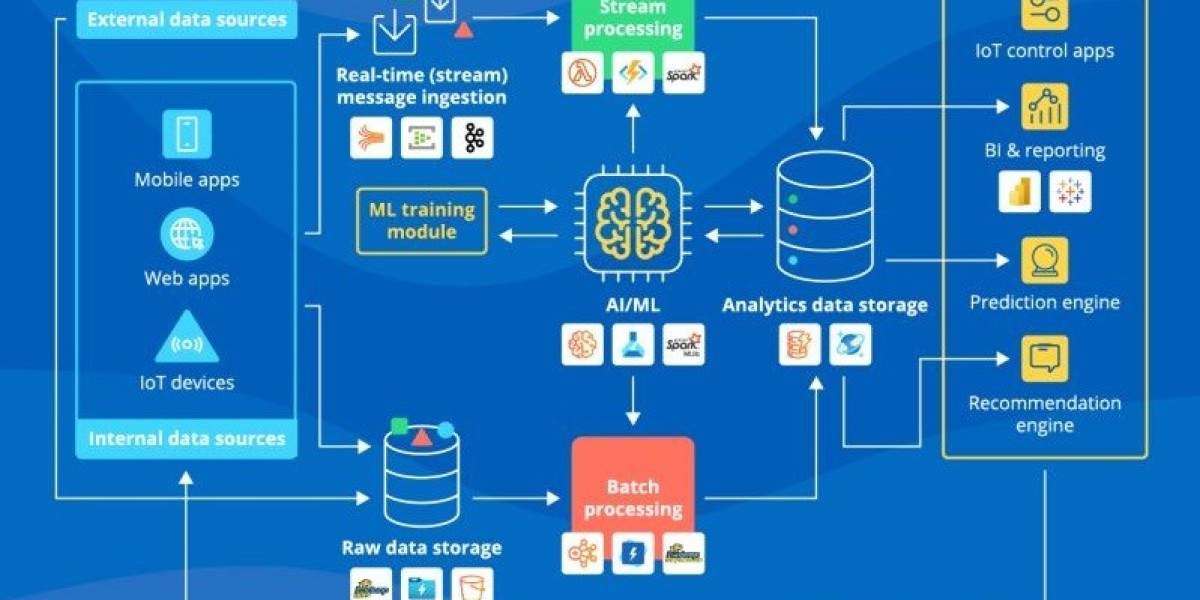
Data analytics is the process of examining information to discover patterns, answer questions, and support decisions. It combines data collection, preparation, statistical methods, and technology to turn raw facts into useful findings. Organizations use analytics to understand customers, improve operations, forecast demand, and measure performance. The work may involve simple calculations, such as comparing monthly sales, or advanced techniques, such as machine learning. Analytics is valuable because it replaces guesswork with evidence, but it does not make decisions automatically. People must interpret results in context, consider limitations, and choose appropriate actions. Reliable analysis begins with a clear question: What problem needs solving, and what evidence would help? From there, analysts identify relevant data, check its quality, select suitable methods, and communicate conclusions in language decision-makers can use. When practiced responsibly, data analytics helps individuals and organizations make more informed, timely, and accountable choices.
Four Common Types of Analytics
Data analytics is often grouped into four types. Descriptive analytics explains what happened, using summaries such as sales totals, website visits, or customer retention rates. Diagnostic analytics investigates why something happened by examining relationships, segments, and possible contributing factors. Predictive analytics uses historical data and statistical or machine-learning models to estimate what may happen next, such as future demand or the likelihood of equipment failure. Prescriptive analytics explores possible actions and their expected consequences, helping teams compare options under specific constraints. These categories build on one another, but they are not a guaranteed sequence, and more complex analysis is not always better. A clear descriptive report may be more useful than a complicated prediction if the underlying data is incomplete. Organizations should match the analytical approach to the question, available evidence, and decision at hand. Understanding these distinctions helps teams set realistic expectations and avoid treating forecasts as certainties or correlations as proof of cause.
The Analytics Process
A dependable analytics project follows a structured process. First, define the decision or question precisely, including who will use the answer and what action it may inform. Next, identify suitable data sources, such as transaction records, surveys, sensors, or public datasets, while confirming permission to use them. Prepare the data by correcting errors, addressing missing values, standardizing formats, and documenting assumptions. Then explore the information with summaries and visualizations before applying methods suited to the question. Validate results by checking calculations, testing assumptions, and comparing findings against relevant benchmarks or new data. Finally, communicate the conclusion, uncertainty, and recommended next steps to the intended audience. Analysis rarely ends with a report: teams should monitor outcomes and revisit their assumptions as conditions change. This process supports reproducibility and reduces avoidable mistakes. It also makes clear that technical work is only one part of analytics; framing the problem and explaining the answer are equally important.
Tools, Skills, and Teams
Analytics work draws on tools and skills that vary with the task. Spreadsheets help organize data and perform basic calculations, while SQL is commonly used to retrieve information from databases. Programming languages such as Python and R support data cleaning, statistical analysis, and automation. Visualization and business-intelligence platforms help users explore metrics and share dashboards. Effective analysts also need skills beyond software: statistical reasoning, subject knowledge, careful communication, and the ability to question assumptions. They should distinguish meaningful patterns from noise and explain findings without overstating certainty. Teams often combine analysts with domain experts, data engineers, product specialists, and decision-makers. This collaboration helps ensure that data is technically sound and relevant to real needs. Tool choice should follow the problem, not fashion; a simple, transparent method may be preferable to an elaborate system. Organizations should also invest in documentation and training so that results can be understood, checked, and maintained by people beyond the original analyst.
Data Quality, Privacy, and Ethics
Analytics can produce misleading conclusions when data is inaccurate, incomplete, outdated, or unrepresentative. Before drawing conclusions, analysts should assess how information was collected, whose experiences it reflects, and which values are missing. Biased data can reinforce unfair outcomes, particularly when models affect access to jobs, credit, healthcare, or public services. Privacy deserves equal attention: collect only information needed for a legitimate purpose, restrict access, protect sensitive records, and follow applicable laws and policies. Organizations should explain important uses of data and provide ways to challenge consequential decisions where appropriate. Models and dashboards also require monitoring because populations, behaviors, and systems change over time. Ethical analytics involves more than technical accuracy; it requires accountability, transparency, proportionality, and human oversight. Teams should document data sources, assumptions, limitations, and model performance. These practices help people evaluate whether a result is trustworthy and whether acting on it could cause unintended harm.
Communicating Findings Effectively
A useful analysis must be understandable to the people making decisions. Begin with the main finding, then show the evidence that supports it and explain what it means for the audience. Choose visualizations that fit the message: a line chart can show change over time, a bar chart can compare categories, and a table may be best for precise values. Label axes clearly, provide context, and avoid decorative effects that distort comparisons. Distinguish observed facts from interpretations and recommendations. State important caveats, such as small sample sizes, incomplete records, or uncertainty in a forecast. Avoid overwhelming readers with every calculation; provide technical details separately for those who need them. A strong presentation connects the result to a practical decision and identifies what should happen next. Clear communication does not mean simplifying away complexity. It means making the reasoning accessible while preserving the qualifications necessary for responsible use.